
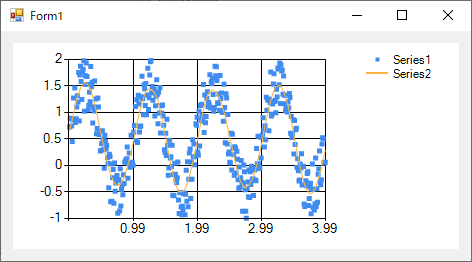
Pythonでsgolayフィルタを使ってみた..NETでもオープンソースのコードがないかなと思っていたのですが,なかなか見つからなかったのでscipyのコードを使うことにしてみた.
自分で探していたけど「SciPy で Savitzky-Golay フィルタ」という参考にmodeなるものも指定できることが分かった.SciPyの方が簡単かな
やっぱり簡単.ただし,Scipyはかなりストレージを使う.これを小さくできたらよいのだが...
C#側のコードは次のような感じにしてみた.
using System;
using System.Collections.Generic;
using System.ComponentModel;
using System.Data;
using System.Drawing;
using System.IO;
using System.Linq;
using System.Reflection;
using System.Text;
using System.Threading.Tasks;
using System.Windows.Forms;
using Python.Runtime;

namespace SgolaySample
{
    public partial class Form1 : Form
    {

        public Form1()
        {
            InitializeComponent();

            System.Windows.Forms.DataVisualization.Charting.ChartArea chartArea1 = new System.Windows.Forms.DataVisualization.Charting.ChartArea();
            System.Windows.Forms.DataVisualization.Charting.Legend legend1 = new System.Windows.Forms.DataVisualization.Charting.Legend();
            System.Windows.Forms.DataVisualization.Charting.Series series1 = new System.Windows.Forms.DataVisualization.Charting.Series();
            System.Windows.Forms.DataVisualization.Charting.Series series2 = new System.Windows.Forms.DataVisualization.Charting.Series();
            this.chart1 = new System.Windows.Forms.DataVisualization.Charting.Chart();
            //
            // chart1
            //
            chartArea1.Name = "ChartArea1";
            this.chart1.ChartAreas.Add(chartArea1);
            legend1.Name = "Legend1";
            this.chart1.Legends.Add(legend1);
            this.chart1.Location = new System.Drawing.Point(12, 12);
            this.chart1.Name = "chart1";
            series1.ChartArea = "ChartArea1";
            series1.ChartType = System.Windows.Forms.DataVisualization.Charting.SeriesChartType.Point;
            series1.Legend = "Legend1";
            series1.Name = "Series1";
            series2.ChartArea = "ChartArea1";
            series2.ChartType = System.Windows.Forms.DataVisualization.Charting.SeriesChartType.Line;
            series2.Legend = "Legend1";
            series2.Name = "Series2";
            this.chart1.Series.Add(series1);
            this.chart1.Series.Add(series2);
            this.chart1.Size = new System.Drawing.Size(446, 206);
            this.chart1.TabIndex = 0;
            this.chart1.Text = "chart1";


            this.Controls.Add(this.chart1);

            string strPath = Environment.GetEnvironmentVariable("PATH");

            string appDir = Directory.GetParent(Assembly.GetExecutingAssembly().Location).FullName + @"\python";

            Environment.SetEnvironmentVariable("PATH", Path.PathSeparator + appDir, EnvironmentVariableTarget.Process);


            List<double> x = new List<double>(); // Python listへの変換予定
            List<double> y = new List<double>(); // Python listへの変換予定

            Random random = new Random(0);
            for (int i = 0; i < 400; i++)
            {
                x.Add(0.01 * i);
                y.Add(Math.Sin(2.0 * Math.PI * x[i] / 1.0) + random.NextDouble());
            }

            using (Py.GIL())
            {
                dynamic sys = Py.Import("sys");
                // sample.pyを置くフォルダをパスに追加
                sys.path.append(Directory.GetParent(Assembly.GetExecutingAssembly().Location).FullName);
            }

            using (Py.GIL())
            {
                dynamic sample = Py.Import("sample");
                dynamic ya = sample.filterA(y); // numpy.arrayで返ってくる予定

                for (int i = 0; i < x.Count; i++) {
                    chart1.Series[0].Points.AddXY(x[i], y[i]);
                    chart1.Series[1].Points.AddXY(x[i], ((double[])ya)[i]);
                }
            }
        }
    }
}
sample.pyの例
import numpy as np
from scipy import signal

def filterA(y):
    ya = signal.savgol_filter(y, 101, 5);
    return ya;
タグ:Python , Windows Forms
