
Pythonヒストグラムの作成について
Pythonでヒストグラムを作成してみた。
バーの周辺にエッジをなくす場合にはedgecolor="none"とするらしい。
import numpy as np
import matplotlib.pyplot as plt
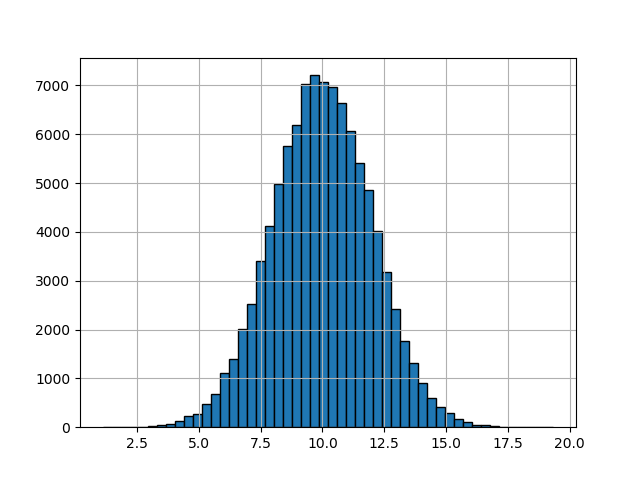
R = np.random.randn(100000) * 2. + 10.;
plt.hist(R, bins=50, edgecolor="black");
plt.grid();
plt.savefig('test2.png');
plt.show();
